
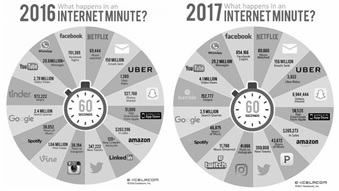
In recent years, we have witnessed an exponential growth of the amount of data we are generating. As an example, consider the numbers depicted in Figure 1, that shows what happens in one minute in Internet, for both the years 2016 and 2017. In a single minute, approximately 150 million email are sent, 350 thousand new tweets appear in Twitter, and 40 thousand posts in Instagram, both in 2016 and in 2017. But the figure allows us also to see the impressive growth, in a single year, of some statistics: the search queries in Google raised from 2.4 to 3.5 million, video views in Youtube jumped from 2.78 to 4.1 million, and Uber Rides almost triplicated, from approximately 1300 to 3800.
WhatsApp messages exchanged went from 20 to 29 million.
There is an explosion of data, and the natural question is whether we can use it to improve our daily lives. We already witnessed some examples in which we can exploit the data: Google Maps has real time information about traffic data, and suggests us the fastest route available according to this info. Amazon knows what we bought, i.e., what we like, and can suggest us similar items based on shopping preferences of people that have similar tastes. Apple (and other companies) can recognize our friends in the pictures, that are geolocalized thanks to the built-in GPS in our smartphones, and helps us in retrieving and organizing them. We choose restaurants and hotels based on the feedback of thousands of customers in Tripadvisor. Big Data is already in our lives. In the following section, we will try to provide a better picture of what Big Data is. Then, the natural question become “How can we use it?”
To answer the above question in this chapter, we begin by briefly presenting few stories in which data plays an important role. We start from baseball, then we focus on television, and we conclude with one of the most famous and successful case of using Big Data: the Google Flu case. These cases illustrate the value that is hidden in the data; it is not by chance that the field of research useful information in big data is known as Data Mining: you have to mine and dig into your database to find the hidden gems.
We then discuss another field where data is the fuel: Machine Learning, a subfield of Artificial Intelligence where the computer is provided example to learn from. The recent victory of AlphaGo, an Artificial Intelligence built by DeepMind, a Google owned company, against the world champion of Go, is an example of the potential of Machine Learning techniques.
We conclude by addressing the future of Big Data: there is a new devoted professional figure, known as Data Scientist, that has been defined by Harvard Business Review “the sexiest job of the 21st Century”. Also, we briefly discuss the Internet of Things, an already important source of data destined to grow impressively in the next years.
What is, exactly, Big Data?
The term Big Data dates back to the ’90s, but it became very popular since the beginning of this millennium; in particular, a report of the META Group in 2001 defined the challenges of Data Management as a three-dimensional problem, in which we need to control the Data Volume (its size), Velocity (the stream of data), and Variety (we deal with several distinct types of data, from structured data like tables in a database or in a spreadsheet to unstructured data like text, image, and video files).
After this report, the 3Vs (i.e., Volume, Velocity, and Variety) are considered the defining properties of Big Data. Several analysts added other Vs, including Veracity (i.e., the reliability of the data), Visualization (we need visual tools to deal with massive amount of data!), Variability (the data changes over time), and Value (what is the value of this data?).
Another definition of Big Data is simply “data that is big enough that you cannot store in a single computer”, you need a devoted infrastructure. And what are the tools to deal with Big Data? To this question, we ask back: “what are the tools to deal with small data, i.e., the files we use everyday?” Everybody who uses a computer on a daily basis knows that there is no single correct answer: we use dozens of programs, depending on the file types; we can use Word or OpenOffice to open rich text files, whilst a simple notepad is enough for plain text files. We use IDEs (i.e., Integrated Development Environments) like Eclipse to write source code files in several programming languages, we use VLC to open video files, etc.
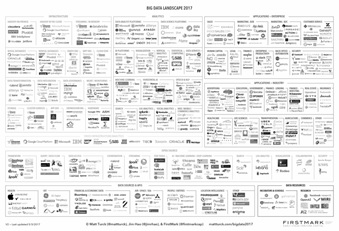
The list could go on and on; the same happens with Big Data: there is no single type of Big Data, there are hundreds, and there are corresponding framework to deal with each type; some of these frameworks are shown in Figure 2. For example, just to name few Big Data types and framework [1], we can say that:
- Apache Hadoop, the open source implementation of Google’s MapReduce framework, is well suited to process massive data in batches;
- Apache Spark and Storm, the latter originally developed by Twitter, can deal with streaming data;
- Apache Arrow was designed to deal with large tabular data;
- Apache Giraph, the open source implementation of Google’s Pregel, is optimized for graph structured data, such as computer or social networks.
This variety, as we discuss later, is one of the reasons that led to the development of a new type of professional figure, devoted to the analysis (and the management) of Big Data: the Data Scientist.
Moneyball: the art of winning an unfair game.
The first story we discuss is related to the baseball game, and it is the famous story of Billy Beane, the General Manager of the Oakland Athletics baseball team’s 2002 season. In 2003 Michael Lewis wrote a book about this season, and in 2011 this nonfiction novel became a movie starring Brad Pitt in the role of Billy Beane.
At the beginning of the 2002 season, Billy Beane has to assemble the team, after the departures of some star players. Traditionally baseball teams have several scouts that are in charge of finding good players. There is a nice scene of the movie in which Beane is in a room full of scouts, and they discuss the players they should buy, commenting on several issues, and one of the scouts says about a potential new player: “He’s got an ugly girlfriend. Ugly girlfriend means no confidence”. This is a(n extreme) example of non-data based evidence.
Beane decided to change: he doesn’t listen to the scouts’ advice and hire a young Yale graduate, Peter Brand, that developed a method based only on the analysis of data. Brand convinces Beane by saying: “Your goal shouldn’t be to buy players, your goal should be to buy wins. And in order to buy wins, you need to buy runs.” His idea, roughly speaking, is to search for the runs in the data collected by measuring in-game activities. This approach is called sabermetrics, from the acronym SABR of the Society for American Baseball Research. So, in order to choose the players, Brand did not watch games, but run algorithms on game-generated data.
The sabermetrics approach used by Beane and Brand proved to be effective: the Oakland Athletics team is competitive with teams with much higher total payroll ($44M of the Oakland vs the $125M of the New York Yankees) and, despite they do not win the league, they manage to win 20 consecutive games.
Netflix and House of Cards
Netflix is a worldwide known company, that nowadays offers streaming of movies, documentaries and tv series for a monthly fee. Before detailing how Netflix decided to produce its series House of Cards, let us briefly recall the story of Netflix.
Netflix was founded in 1997, a year in which the movie rental scene in the US was dominated by Blockbusters, a video rental shop chain. Instead of the classical video rental model proposed by Blockbusters, in which you rent a movie for a fixed price and have a limited number of days to return it, Netflix proposed an unlimited number of rentals at a fixed monthly price. The user had access to the Netflix website, where he could select the dvd to be delivered to him by mail. Once he has seen the video, he could send it back via mail, asking for another one using the platform.
There is a traditional story about the founding of Netflix: Reed Hastings had the idea of Netflix after paying forty dollars in late fee for an overdue copy of the movie Apollo 13. This story didn’t really happen, but it was used to explain the model of Netflix: no due dates, no overdue fees.
Blockbusters didn’t perceive Netflix as a dangerous adversary: indeed they had the opportunity to buy it for $50M in 2000, but they refused. Few years later, in 2005, the commercial war between Blockbusters Online, the streaming division of Blockbusters, and Netflix arrived at a hype, and Hastings in a conference declared that “Blockbusters was throwing everything at them but the kitchen sink”. The next day Antioco, Blockbusters’ CEO, known for his sense of humour, sends a kitchen sink to Hastings.
As we know now, Netflix won the war. And during those years, having a single point of access for all its users – the website – Netflix collects data about the preferences of the users. And the data become even better when they switch from the dvd by mail rental mode to streaming mode; now they know everything about the users and their preferences: how many time they watch a single episode of a series, when they pause, when they rewind, when they fast-forward. Netflix is so focused on the data that launched a competition, with one million dollars’ award, for a better algorithm – they already have one – able to recommend contents to users based on their previous choices.
Few years ago, when Netflix decided to produce a new television series, it started mining into its data. A good share of its user liked the work of David Fincher, the director of “The Social Network”; the movies with Kevin Spacey are always a success, and finally many users liked a British series called “House of Cards”. The overlapping of these three sets of users was good, so they decided to produce a remake of “House of Cards”, starring Kevin Spacey, directed by David Fincher. The series is now considered a world success, and it is currently at its fifth season.
Thus, nowadays many analysts consider the data that Netflix collected in these years its secret weapon, that lets Netflix estimate with high accuracy the growth in each quarter, content usage patterns and the costs. But an interesting competitor is entering in the field of streaming content: Amazon, with its Prime Video, available to subscribers of the Amazon Prime membership, that includes access to movies, music, e-books, and free shipping. And Amazon knows its users very well.
Google Flu
So far, we have presented two examples of data usage that appear quite natural: in the first we have seen how baseball generated data is used to choose baseball players, and in the second how user video preferences are used to decide which series to be produced. The third example shows all the potential of big data analysis.
In 2008, Google launched Google Flu, a system designed to predict the spread of seasonal influences. The idea was simple, and based on the fact that, nowadays, if someone feels sick it is likely that he will search on the web, i.e. on Google, the symptoms he is feeling. So, if a new influence is spreading in a particular area, the queries from that area to the search engine, related to the flu symptoms, will be higher than the average. In the US, the spread of seasonal influences is tracked by the U.S. Centers for Disease Control and Prevention (CDC). The results of Google Flu, published also in Nature (Ginsberg , Mohebbi, Brammer, Smolinski, & Brilliant, 2009), showed that there was a high correlation between the data of Google Flu and the data of CDC, with a significant advantage of the former: the data is available approximately 1-2 weeks earlier. This can help in the fight against the diffusion of the influences.
The above example is, as mentioned before, an example of the power of big data analysis: using the dataset consisting of all the queries to google from a specific area, together with sophisticated statistical models, it is possible to predict the spread of influences! In recent years however, the effectiveness of Google Flu decreased: the prediction made by the models and the data reported by the CDC started being increasingly different, and in 2015 they decided to close the service.
Data as examples to learn from: Machine Learning
In 1997 Garry Kasparov, the reigning world chess champion, was defeated by a computer program: IBM Deep Blue. 20 years later, in 2017, Ke Jie, the reigning go champion, was defeated by a computer program: Google AlphaGo. There is a huge difference between the two matches: Deep Blue was programmed by IBM in the traditional way, also known as “imperative programming”: the coders give instructions, the computer executes them.
Thus, the Deep Blue code, at least for the first part of the match, was something like: “if the adversary moves the Queen here, move the pawn there”. For the middle of the match it used some algorithms, carefully designed by programmers, in which each piece has a value that depends on its position, how many and which pieces it menaces, and how many and which pieces menace it. This value is used to compute the most useful move, together with some other parameters, including the race to develop control of the whole board.
After the victory of Deep Blue, there was only one game in which computer was not able to compete with human masters: the go game. The go is an ancient Chinese board game, with simpler rules if compared to chess. However, the dimension of the board (19×19), the possible number of moves in each turn (approximately 80 vs 35 of chess) and the length of an average match (160 moves per side vs 80 in chess) make the go game much more difficult from a computational complexity point of view. This prevented coders to develop an algorithm able to compete against human masters.
In 2017, Google’s owned company DeepMind developed AlphaGo, an artificial intelligence built using machine learning techniques: in machine learning we do not program computers, we show them examples, and they learn from the examples. Google trained AlphaGo by showing it go matches played by the best players in the world, and AlphaGo learned from these examples how to play go. Few month before the official match, AlphaGo won three online matches against Ke Jie. The world champion posted on Weibo, a chinese social media similar to Twitter: “I have a last move” to defeat AlphaGo.
But AlphaGo improved before their match: they made it play against itself millions of matches, and later used these matches as examples to learn from. AlphaGo became its own teacher. Ke Jie declared: “Last year, it was still quite humanlike when it played. But this year, it became like a god of Go.” (Mozur, 2017).
This is an extreme, world class example of machine learning. It is interesting to point out that the algorithmic ideas of many machine learning techniques, including AlphaGo’s Deep Learning, are around us since the eighties, but working applications appeared only recently due to two factors:
- The increased computational power provided by current computers;
- The increased availability of massive data to learn from.
Andrew Ng, former Baidu Chief Scientist, Coursera co-founder and Stanford professor, recently declared that “Artificial Intelligence is the New Electricity”: almost every new device will be fueled by Artificial Intelligence, and the majority of these device will be based on Machine Learning techniques, i.e., they will be built on the data. Data is the new oil.
Dealing with Big Data: the Data Scientist
In all the examples we discussed so far, the main actors were, together with the data itself, the professionists able to mine gems from the massive data.
In Figure 2 we can see the Big Data Landscape: all the most important tools, frameworks, infrastructures, applications to manage Big Data are shown in this figure. In this scenario, it is natural to have a professional figure able that is specialized in the mining of Big Data and knows, depending on the situation, the right tool to be used.
This professional figure is currently known as the Data Scientist, and had been defined, as we already mentioned, “the sexiest job of the 21st Century” in a popular article appeared in Harvard Business Review (Davenport, 2012).
The Data Scientist must possess a unique mix of competences: math, statistics, probability and computer science. And they need to work closely with application domain experts or to develop a working knowledge of the application field. In a study by IBM, the total number of Data Scientists estimated in the US job market in 2020 is 2.7 milion (Burning Glass and IBM, 2016).
Big Data is here to stay: the Internet of Things
One could wonder if this data explosion we are witnessing is a temporal phenomenon only. Actually, our ability to generate and collect data will keep on growing, thanks to a new phenomenon we are beginning to face: the Internet of Things, i.e., the era in which almost everything is connected (and every connected device generates data!).
Consider the birth of Internet: it was a network able to connect few supercomputers of universities and military bases. Then we entered in the age of “a computer on every desktop”, and we connected all these computers to Internet. Then arrived the smartphones, the tablets, and we connected them as well. Now we have smart products that are connected and can offer new services, such as a smart fridge that can send you a message to remind you to buy the milk.
According to a report of Gartner, the number of connected smart devices in 2017 outnumbers the world’s population: 8.4 billion devices, around one billion more than humans. In 2020, the estimated number of connected devices is 50 billion. Big Data will be Bigger.
Conclusions
We already mentioned that data is the new oil, but there is one important difference: when we process data we get more data. New devices will be smarter, able to generate data that will be used to design new products, that in turn will generate more data.
Our products and application will be smarter. We hope that humans will be smarter too.
We refer the interested readers to the following books for more information on these topics: Big Data (Mayer-Schönberger & Cukier, 2013), Internet of Things (Greengard, 2015), and Machine Learning (Alpaydin, 2016).
Footnotes
[1] We only mention free open source frameworks.
References
Alpaydin, E. (2016). Machine Learning. MIT press.
Burning Glass and IBM. (2016). The Quant Crunch: Demand for data science skills is disrupting the job market. Retrieved from www.ibm.com: https://www.ibm.com/analytics/us/en/technology/data-science/quant-crunch.html
Davenport, T. H. (2012, October). Data Scientist: The Sexiest Job of the 21st Century. Harvard Business Review.
Ginsberg , J., Mohebbi, M. H., Brammer, L., Smolinski, M. S., & Brilliant, L. (2009). Detecting influenza epidemics using search engine query data. Nature, 457, 1012-1015.
Greengard, S. (2015). The Internet of Things. MIT press.
Mayer-Schönberger, V., & Cukier, K. (2013). Big Data: A Revolution That Will Transform How We Live, Work, and Think. Boston: Houghton Mifflin.
Mozur, P. (2017, 5 23). Google’s AlphaGo Defeats Chinese Go Master in Win for A.I. The New York Times, p. 1.


